Nothing better than an organization chart to illustrate a hierarchical structure or organize ideas! Word, Excel, PowerPoint and Outlook integrate a special tool for this type of graph, with dozens of presentations, classic or original. Demonstration with Word.
Want to give your readers a visual representation of your information and ideas? Office applications include an excellent module for creating flowcharts and diagrams of all kinds, SmartArt. Once you have mastered its main tools - and you will find plenty of tips here! -, it will allow you to quickly create good quality illustrations. And, above all, well suited to the message you want to convey: produce a business organization chart, "wake up" a bulleted list with colors, images or graphic shapes, present a process, a conceptual or production cycle, a hierarchy, a relationship, a progression ...
SmartArt graphics were already there in Office 2007, so you don't need the latest version of the office suite. The module has of course been expanded over time and today offers the same options in paid Microsoft Office applications for Windows and macOS.
While it is not allowed to create one in the free Word, Excel, and PowerPoint for the web apps, it is quite possible to open and edit a document with a SmartArt online there (the graphic is displayed as a non-editable image), then retrieve the document with its SmartArt, intact and editable, in the apps for Mac and PC.
How to make an organization chart in Word?
First select the correct graphic. There are different types of diagrams to choose from, including flowcharts that offer a hierarchical structure.
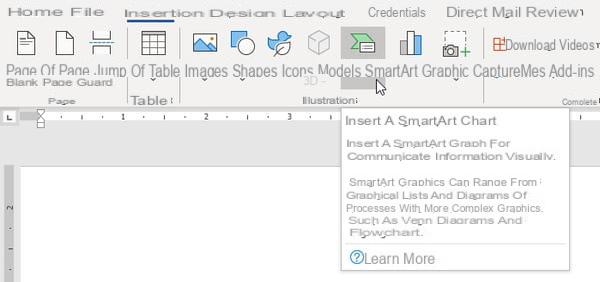
- In Word, Excel or PowerPoint, to create an organization chart, go to the tab Insertion, group Illustrations, and click SmartArt.
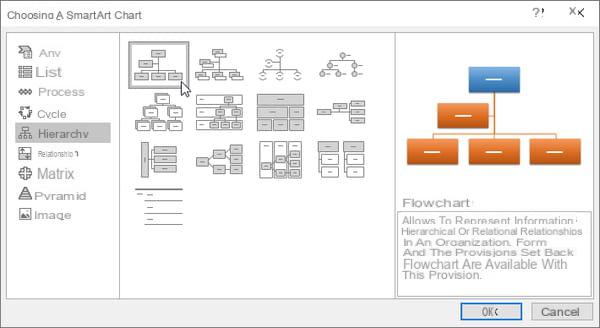
- In the Choose SmartArt Graphic window, explore the different diagrams. The simple flowchart is listed first in the section Hierarchy. The next one makes it easier for you to enter a person's name and title. If you plan to insert images in your organization chart, take a detour through our section Create an organization chart with images before coming back here.
- Word inserts the chosen SmartArt graphic along with some sample data into your document. When the graphic or one of its elements is selected (and only in this case), a special blue tab, SmartArt graphic creation, appears to let you edit or customize your SmartArt. If this tab is not automatically activated to present its tools to you, double-click in an empty area of your organization chart.
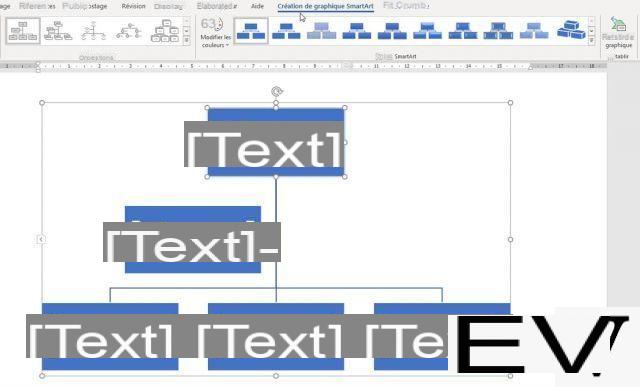
- Can't see this tab on your portable Mac? The definition of the screen probably does not allow all the tabs to be displayed. Click on the gray herringbone to the right of the tab Displays and Signage to discover the following tabs.

- To the right of the tab SmartArt graphic creation another pop-up blue tab is displayed: Fitness. It will help you to change the presentation and the colors of the elements of the chart. And if the current selection is an image in the SmartArt graphic, a third blue tab will be present: Image format ou Graphics Format, according to the situation.

- Even after starting to feed your SmartArt with information, you can go back to your choice and completely change the type of graphic via the tab Creating a SmartArt graphic> Layouts. Some graphics do not accept hierarchical sub-levels or bulleted lists or images: if they are already present, this info will be hidden but not removed from the Word file.
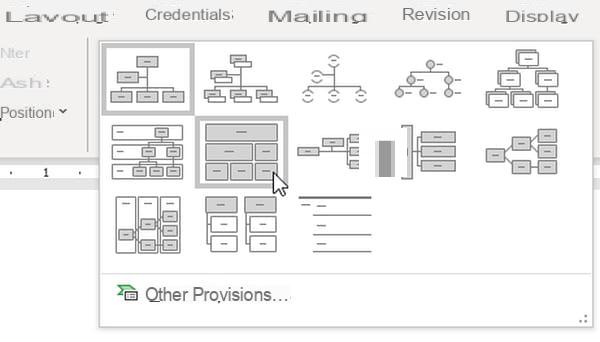
- Otherwise, you can keep the same type of graphic but refine its style (flat, 3D, bricks, etc.) via SmartArt Graphic Design> Layouts> SmartArt Styles. Also note on the right the button Restore the graph, very useful for canceling all formatting changes without touching the information already entered.

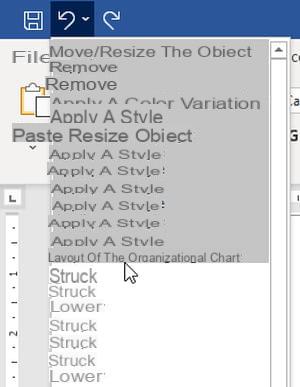
- Remember, moreover, that in this kind of exercise, regrets and unfortunate choices are frequent: press Ctrl + Z on PC or Cmd + Z on Mac to undo the last action (s). As in all Office applications, at the top left of the window, the button Cancel and his sidekick To re-establish are also waiting for you to return to several actions at once.
How to add information to an organization chart in Word?
Structure your information, respect customs, common sense or hierarchy… according to your audience and your desires.
- In a SmartArt graphic, Word calls each block of text a shape. Click in a shape on the word [Text] to enter information. You can also click on the small chevron to the left of the graph to display the Text pane, or click on the button Text pane at the top left of the toolbar. This Type text here pane presents your text information as a simple or hierarchical list.
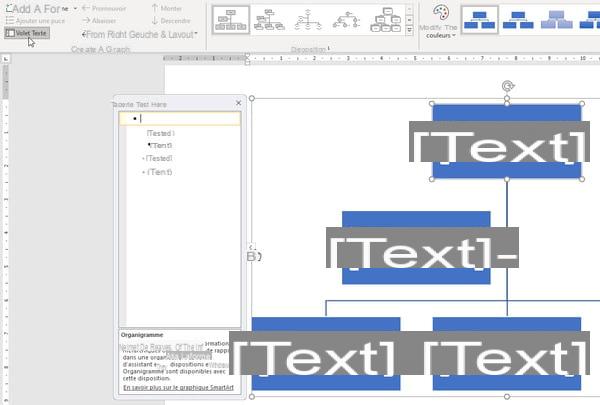
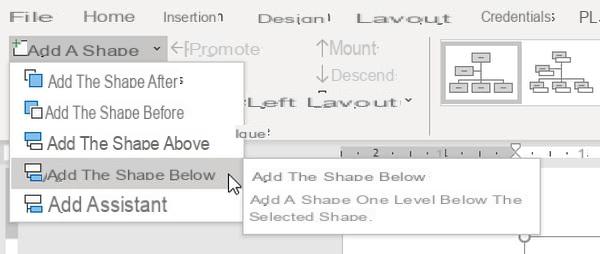
- The options allowed depend on the SmartArt graphic. Let us take the case of an organization chart presenting people or functions within a company, with a classic hierarchical structure. When you select a person, use the toolbar or right-click on their block to add a person after, before, above, or below. Choose for example Add Shape> Add Shape Below if the added person is one level lower in the hierarchy.
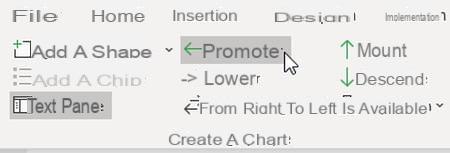
- In the toolbar, buttons are at your service to Promote ou To lower a block in the hierarchy.
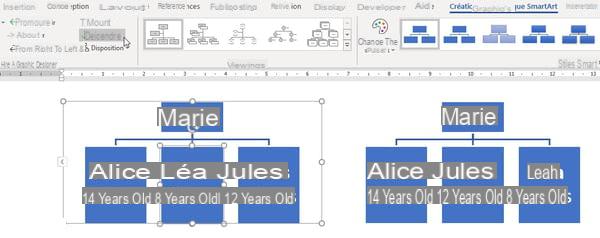
- Buttons are also provided for ascend ou Go down a selected element: if Léa and Jules are at the same hierarchical level, they will remain so, but you will invert their order of appearance: Léa / Jules will become Jules / Léa.
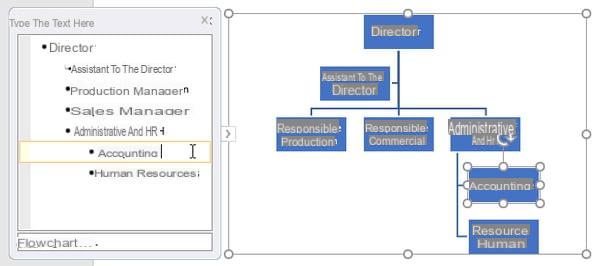
- To feed your organization chart, the Text pane saves you time. Click on an element (place the cursor just after its text) and press the key Starter to add an element of the same level. For To lower an element of a level in the hierarchy, press the key Tab. To promote it, press Maj + Tab. To delete the item, press the key. Going back ou Delete to erase all its text.
- To reverse the entire chart layout, click the button From right to left.
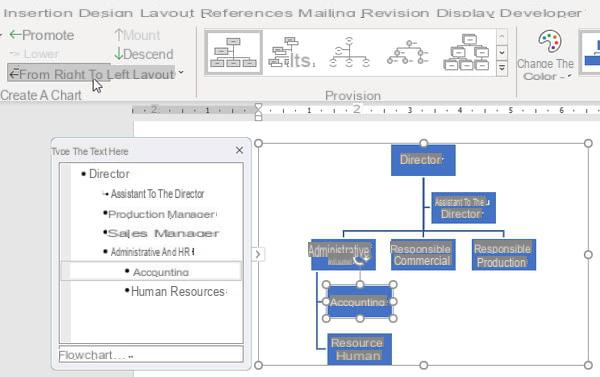
- In a flowchart (but not in most other SmartArt diagrams), anyone can also have an assistant (s). First select this person's block, then create one via Add a shape> Add assistant.
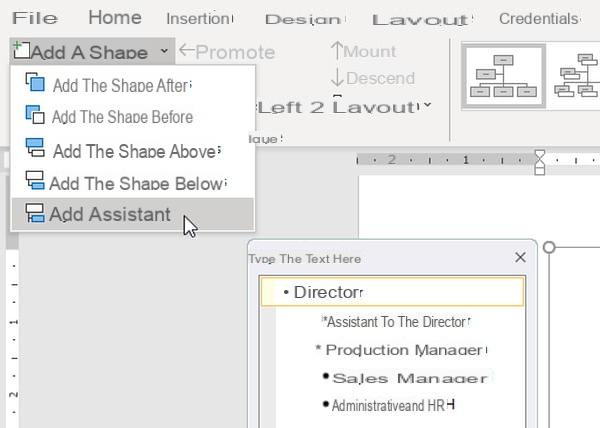
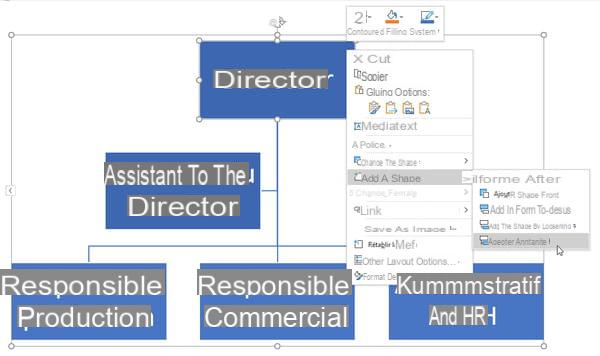
- Assistants will always appear directly after the person they are assisting. You can also attach to a person by right-clicking on the block - here to add a second to the director.
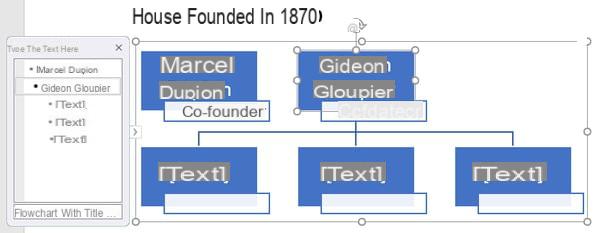
- If everything is not allowed (decision trees, family trees…), by playing on the levels, you can in any case create a two-headed structure, each person possibly having their own hierarchy.
How to change the presentation of an organization chart in Word?
More tips to refine the presentation of the graphic and give color to your SmartArt.
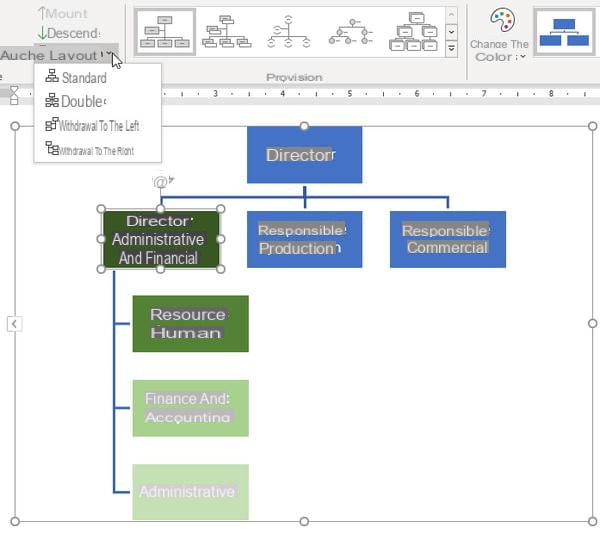
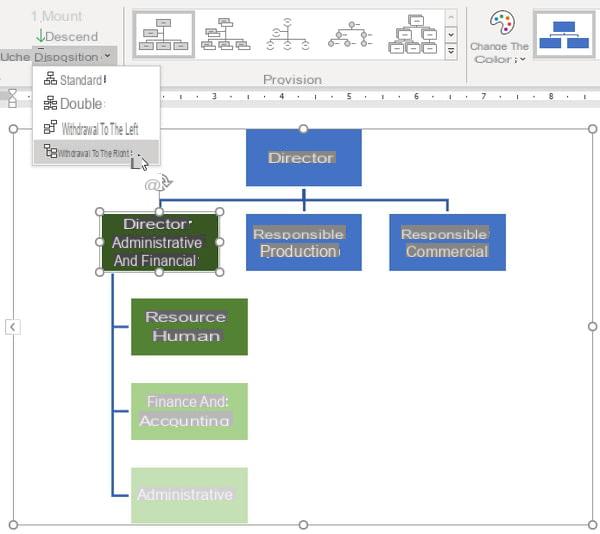
- Word automatically rearranges the chart based on your additions and deletions of information. And the result will not always suit you. If it stacks for example sub-elements when you would prefer a side-by-side display, select the master block (here Administrative and financial) and click on the button Disposal.
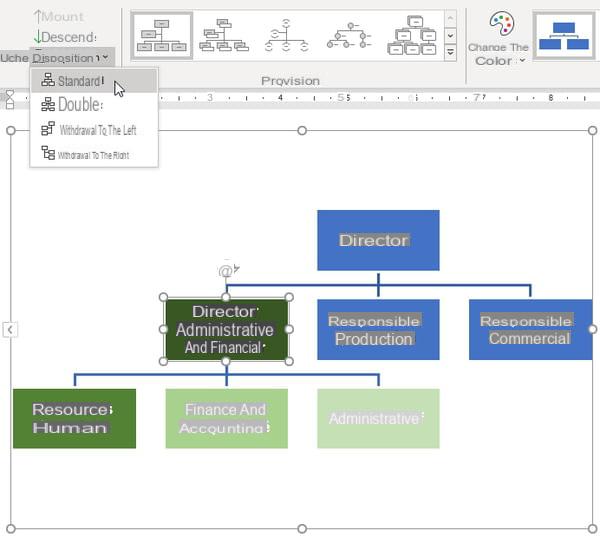
- Here is for the same organization chart, the three services attached to the Administrative and financial manager, with a Disposition > Standard… (Seen side by side below)
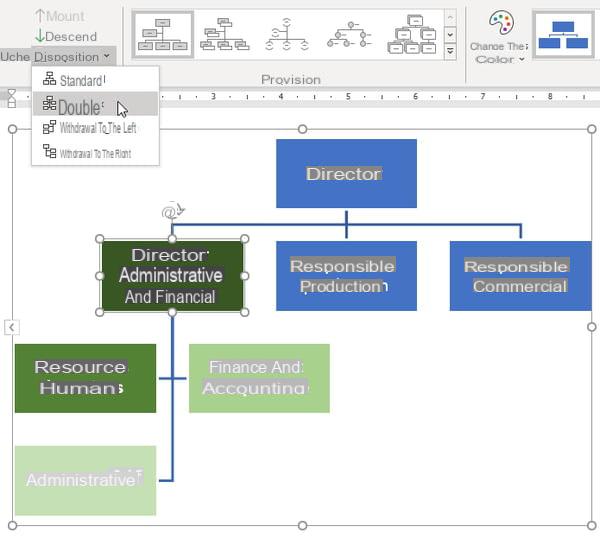
- … with a Layout> Both… (A mix of side by side and stacking)
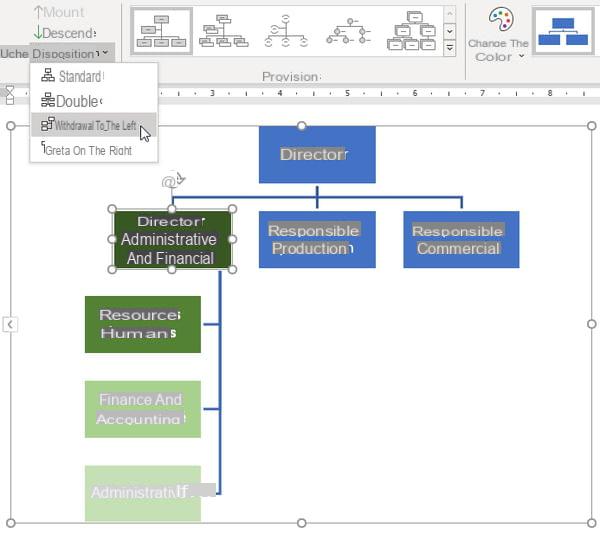
- … with a Layout> Left indent… (But note that this does not affect the level above, which keeps a display Standard side by side)
- ... and with a Layout> Right indent. Use the buttons ascend et Go down to change the order in which the sub-elements appear.
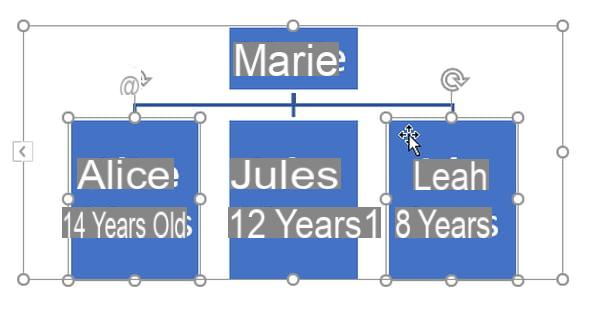
- To select several shapes and apply a particular treatment to them, click on the first one then hold down the key. May to click on others. This multiple selection is only carried out if you click in a part of the box where there is no text: the mouse pointer must be in the shape of a cross.
- The main tab formatting attributes Home - such as the font, size, bold, italics, text color, alignment, etc. - are always available to you.
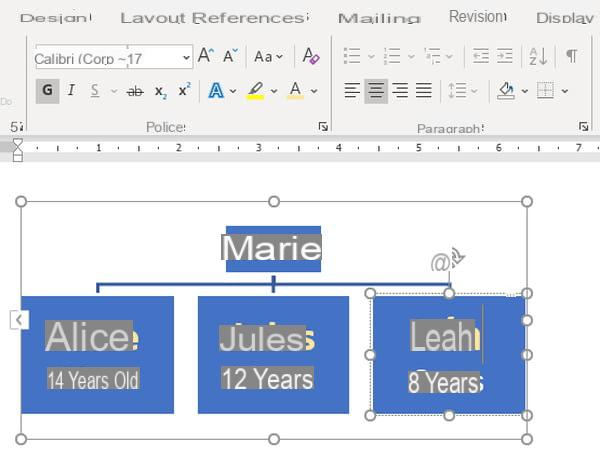
- In a shape, to force a newline at a specific place in the text, go just after it and press Shift + Enter.
- Bulleted and numbered lists usually accessible from the tab Home of Word are not available in a SmartArt. However, some graphics (but not the organization chart) provide for the addition of a bulleted list using the dedicated button Add a bullet in the tab SmartArt graphic creation.
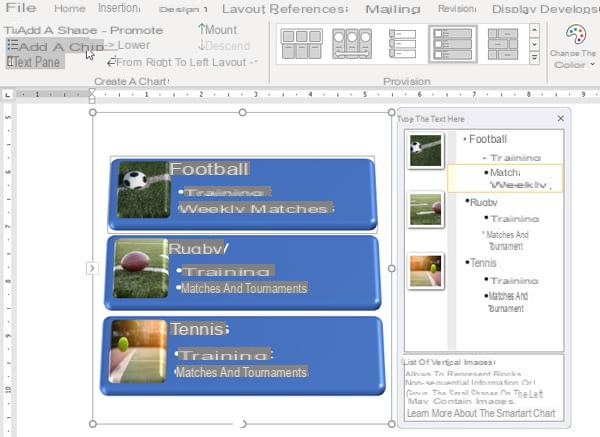
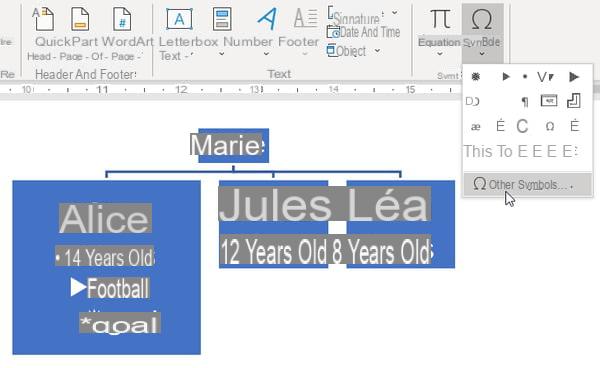
- That said, regardless of the SmartArt graphic, if you really want bullets, you'll get them! Just trick by adding some picked bullets in the tab Insert> Symbols> Symbol> Other symbols.
- To enlarge a block of the graph, click on it then grab and drag one of its handles to modify its width or height ...
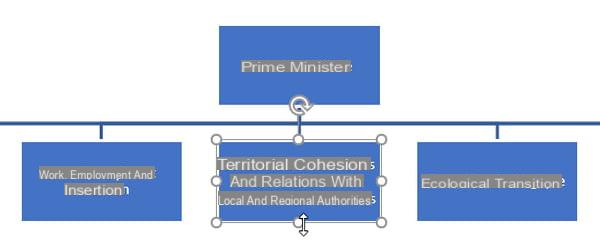
- … And only this shape will be resized.
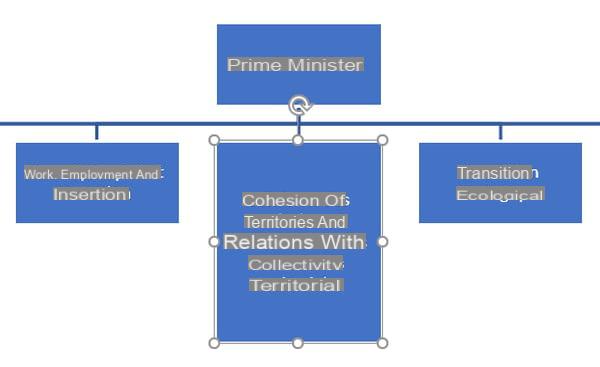
- But sometimes it's better to resize (almost) all shapes at the same time. In this case, click in an empty area of the SmartArt and press Ctrl + A on PC or Cmd + A on Mac, the usual keyboard shortcut to select everything. Would you like to remove some blocks from this full selection? Press the key May and click on it.

- Resize any of these frames by dragging one of its handles with a mouse click: all the blocks will be resized and have the same size.

- To change the color of a single shape, for example click on it with the right mouse button to choose Shape format. In the vertical pane, change the Filling with another color, gradient, image or texture. If your computer screen is not very large, you will avoid displaying the vertical pane through the tab Formatting> groupe Shape Styles> Fill.
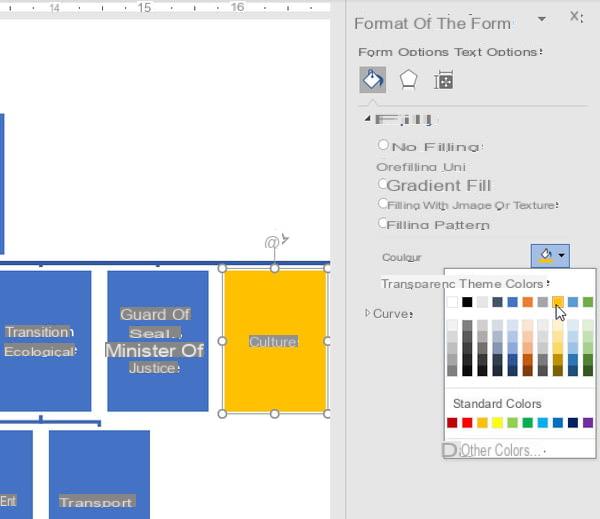
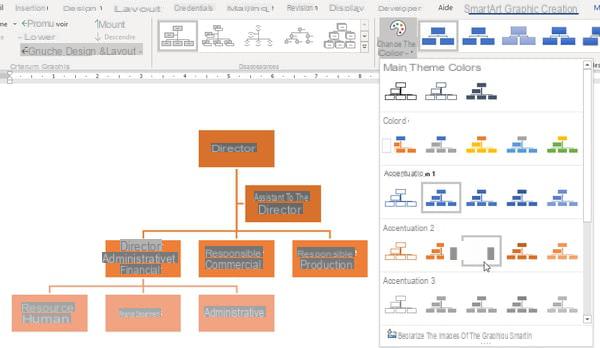
- Or make your life easier: choose an automatic color scheme. The button Change colors is precisely there for that. In the illustration below, in orange tones: the first choice applies an orange frame on a white background, the second applies the same orange color to all the blocks, and the third - which we have selected - applies a different shade of orange at each level: the general manager and his assistant wear the same color, the managers below are a little lighter, etc.
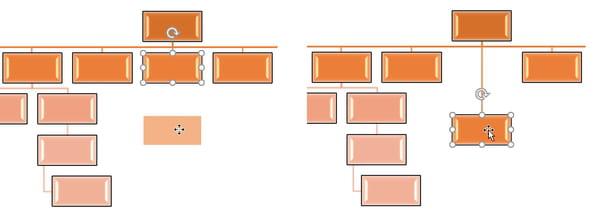
- To move a block, click on it and press the arrow keys on the keyboard. Better, to move it more quickly, grab it with the mouse and drag it to the desired location: press the key at the same time. May if you want it to stay aligned with respect to its starting position.
- It is also allowed to transform a shape by clicking on it with the right mouse button, choice Change shape.
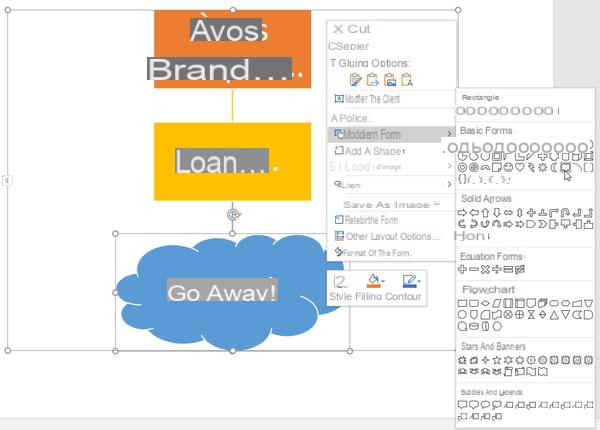
- In SmartArt diagrams with images, you can also apply one of these shapes, such as an arrow, to a photo.

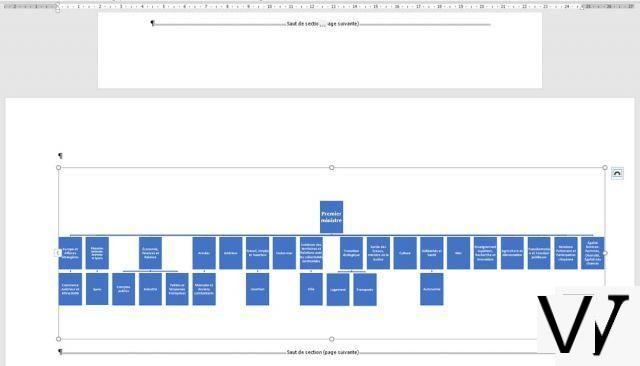
- Finally, if your SmartArt graphic is full width, it may be a good idea to switch your page to landscape mode, and leave the rest of the document in portrait mode. To do this, in the tab Home, go to a paragraph located before the graph and click on the tab Page Layout> Page breaks> Section breaks: Next page. Then go to a paragraph located after the graphic and run the same command again Section breaks: Next page.
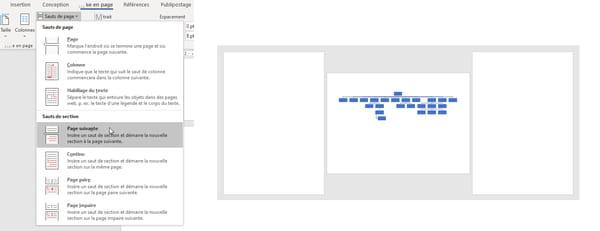
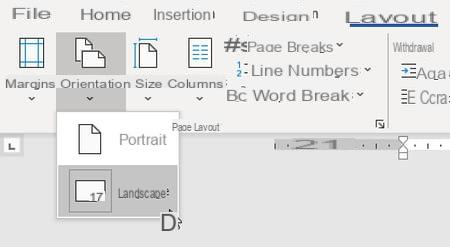
- Click on your chart and, still in the tab LayoutOn Orientation> Landscape.
- Here is the result with visible section breaks: the first page is in portrait mode and ends with a section break, that of the flowchart is in landscape mode and a section break appears just after.
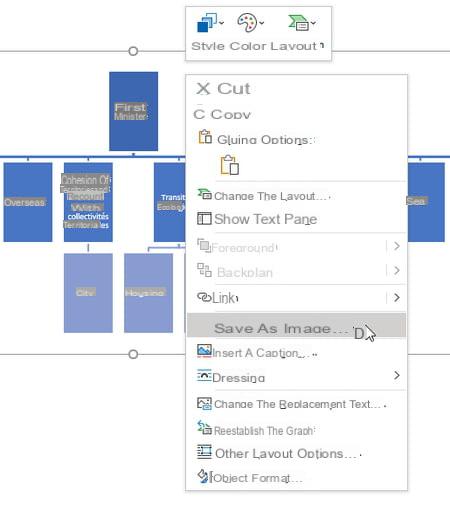
- To export your flowchart to any other application, right-click on it, on an empty area, and choose Save as image. Name the image with a meaningful name and choose an image file format such as JPEG or PNG.
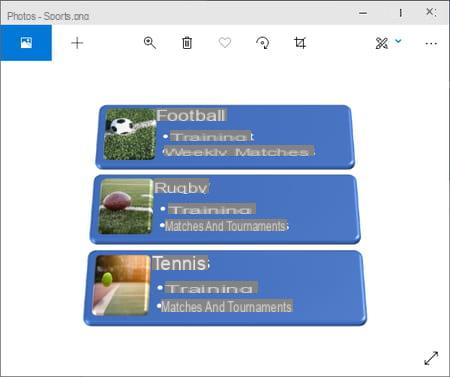
- The larger the diagram in Word, the larger its exported image will be, so it will provide better definition. Below, a Word SmartArt exported in an image in PNG format, viewed in the application Photos Windows 10.
How to create an organization chart with pictures in Word?
Want to add photos of people or places, product images, or concept illustrations to your organization chart? Although it is possible to freely place images anywhere in a Word document, including on top of a SmartArt diagram, it seems much easier to use one of the diagrams with images provided by SmartArt. Our other advice above then remains valid for adding, removing or modifying the information blocks and the presentation of your organization chart.
- Word provides a selection of generic photos and illustrations online that may be of interest to you. If you prefer to use your own photos, prepare them before importing them into Word: the person or element must be cropped as closely as possible, possibly cropped, and the definition of the image often deserves to be reduced (see our tips below).
- To choose the SmartArt diagram that best suits your visual demonstration, click the tab Insertion > group Illustrations > SmartArt and, in the Choose SmartArt Graphic window, click Image in the left column. All the diagrams managing images are presented to you in the central panel.
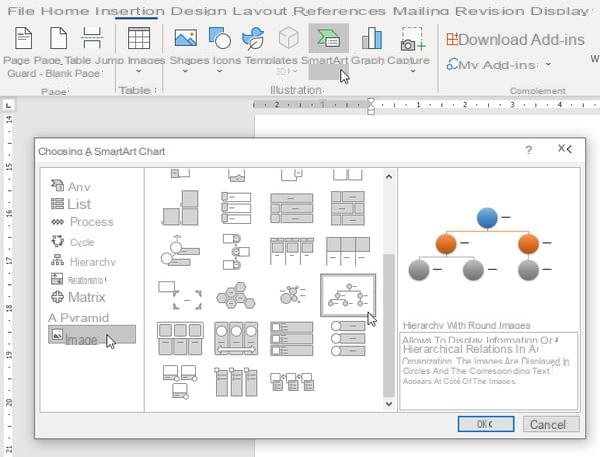
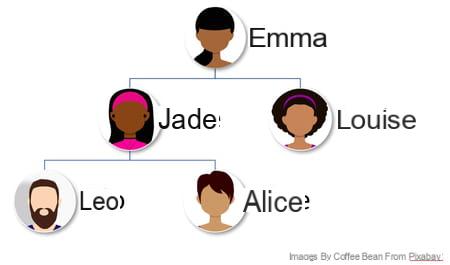
- If, for example, you want a flowchart with pictures like the one below, scroll down the list and select Hierarchy with round images.
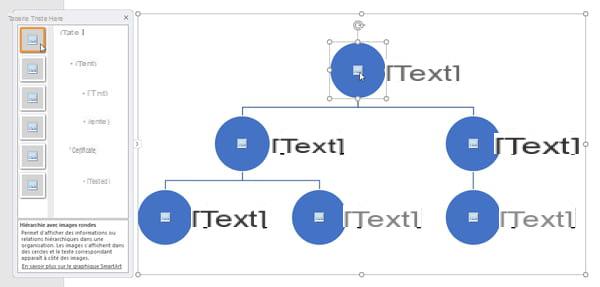
- To add a photo or drawing, click on an image icon directly in the diagram or on the image icon of an element in the diagram. Text pane, if it is displayed.
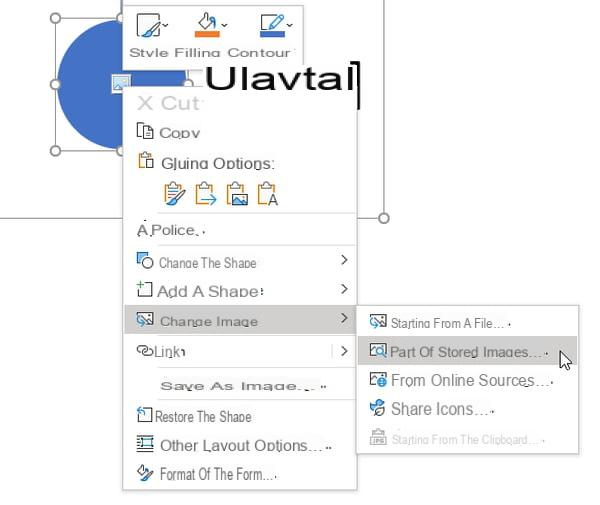
- You can also right-click on a chart shape and choose Change image.
- If the image is on your hard drive, click From file.
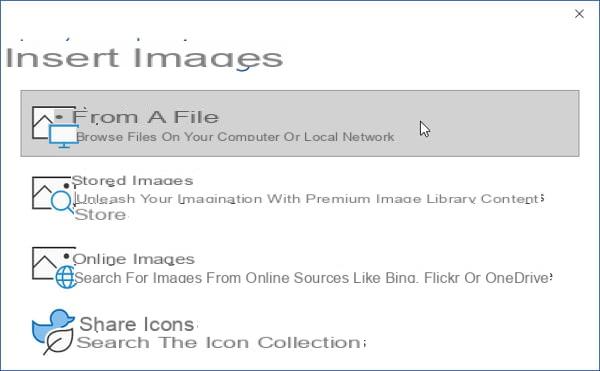
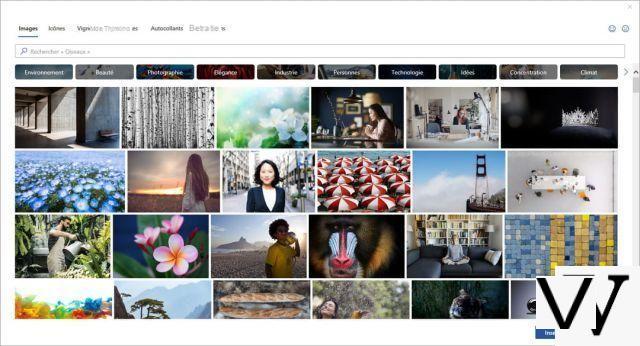
- If you prefer to browse the online image library provided to Word users, either click Stored Images ou From icons. By using the search field (type a single word) and the categories of each section, you can draw a photo in the section Pictures...
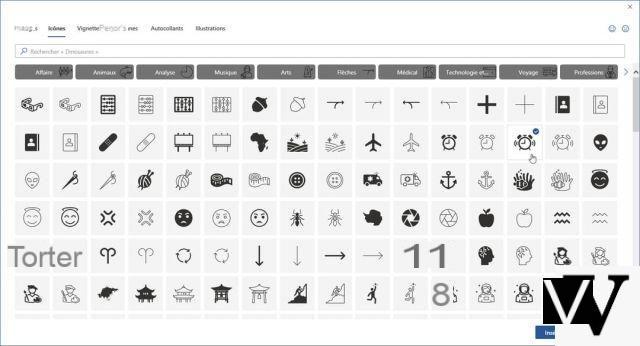
- … or some Icons you can, rest assured, change the color ...
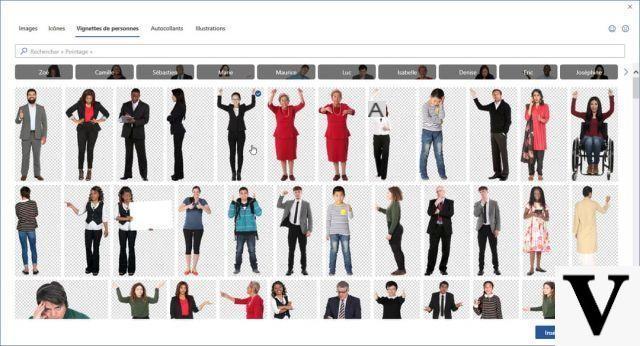
- … or some Thumbnails of people : click on a first name to see all the postures and expressions of the same person ...
- … or some stickers (several series of cute or funny little characters) and Illustrations (wiser vector designs) that you can also recolor.
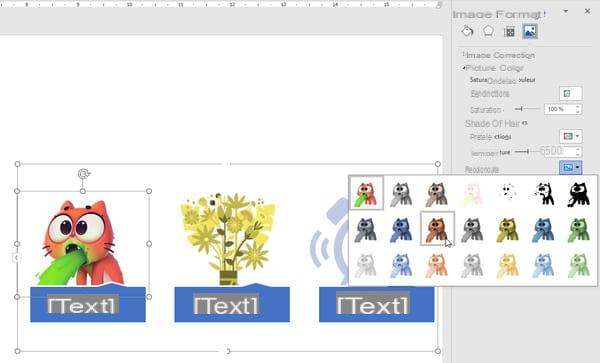
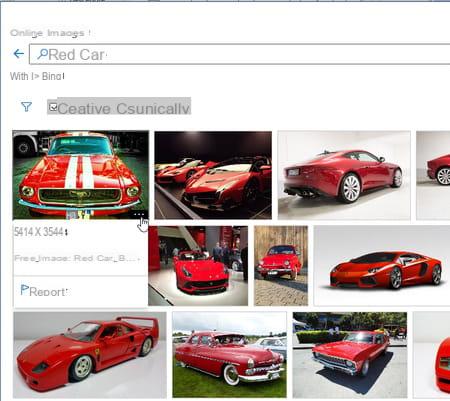
- The window Insert Pictures> Online Pictures Finally, you can search for images using Microsoft's Bing search engine (or your OneDrive storage space). If your material is to be distributed commercially, be vigilant about copyright, even if the checkbox Creative Commons only is checked. The funnel icon is used to filter images according to their size, type (photo, drawing, etc.), format (square, landscape, portrait), tone, etc.
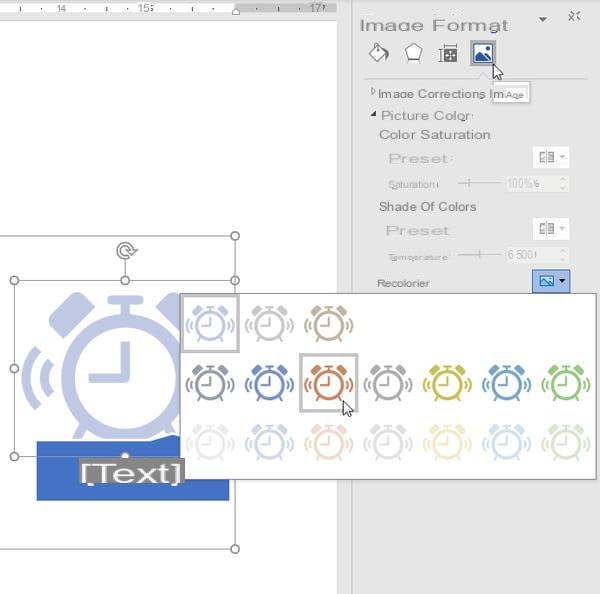
- Whatever image (icon, photo, illustration) inserted in the SmartArt graphic, to change its color, click on it with the right mouse button, choose Image format. In the vertical panel, click on the last icon, Image, then on the section Image color, then on the drop-down button Recolorier.
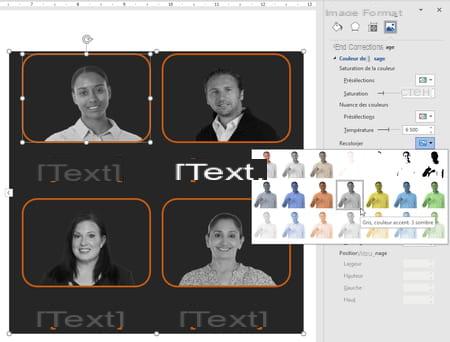
- If your trombinoscope uses, for example, photos from various origins, it is sometimes possible to give a semblance of unity to the whole by applying the same color to each (sepia, gray, blue, etc.).
- To resize an image without overwriting it, grab one of the handles at the four corners, press the key. May and drag the handle to enlarge or reduce the image.

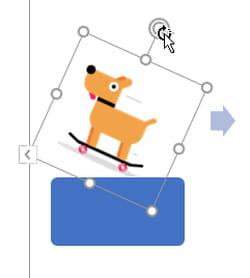
- To rotate the image, you can either grab the handle above the image to flip it ...
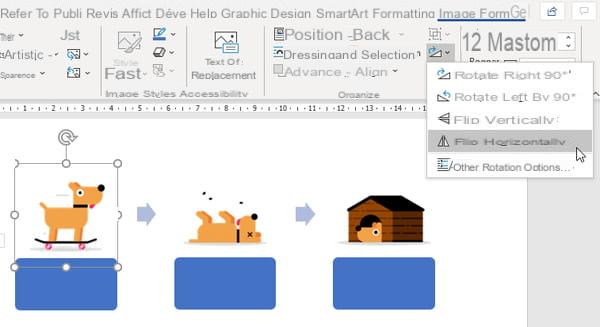
- ... or go through the tab Image format> groupe Organize> Rotation.
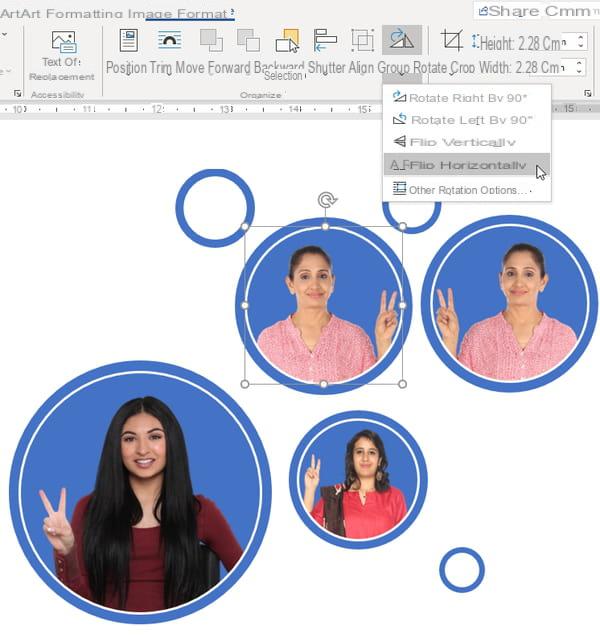
- Flip an image by mirror effect can also be used to standardize a group of photos, below so that the three women do the victory V with their right hand, in this bubble SmartArt.
- To enlarge / shrink an image inside the frame provided by the SmartArt graphic, the easiest way is to select it and choose in the tab Image format> groupe Size> Crop. Grab one of the handles at all four corners to zoom in without distorting the image. With a mouse slide, drag it in its frame to center it on the essential. Click outside the box to finish. The image is not really cropped, so you can refine the recentering by trial and error.

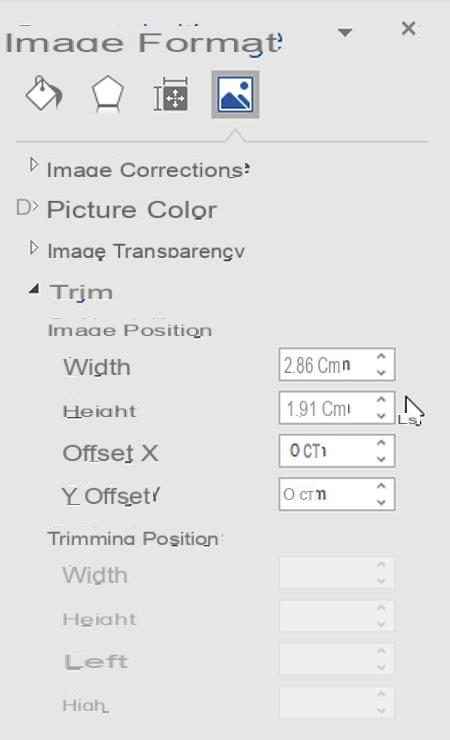
- Another method to zoom in on the image or move it in its frame, in the section Crop vertical shutter, play on the Width et Height. And to reposition it in its frame, scroll the X / Y offset.
- To restore an image that may have been distorted, choose Image format> groupe Size> Crop> Fill. The overwritten image will return to its correct proportions in the SmartArt.
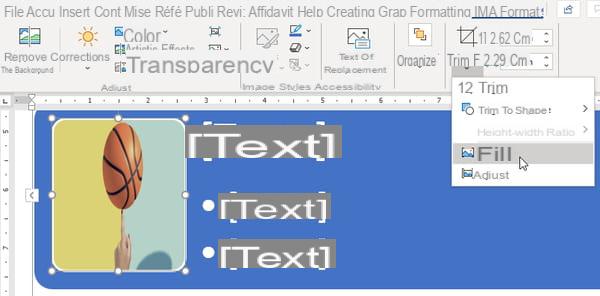
- To delete an image, click on it and press the key. Delete. To replace one, click on it with the right mouse button, choose Change image.
- If you loaded images into a graphic and then change to a type of SmartArt that does not accept them, Word keeps them in memory in case you revert to a graphic with images (but some attributes of the images may change to the hatch).
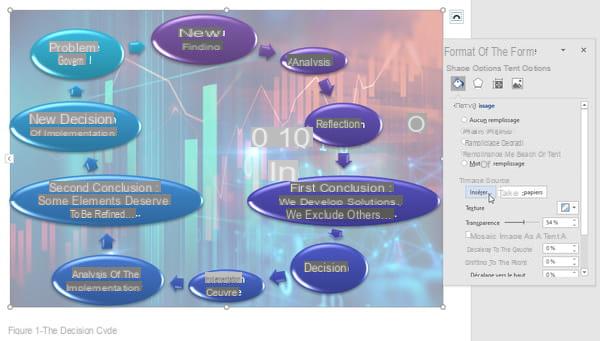
- Finally, to display a background image for the entire SmartArt diagram, right-click in an empty area of the SmartArt, choice Object format. In Shape Options> Fill and Line> Filltick Fill with image or texture. Press the button Insert to select the image from your hard drive, the web, or the image library provided by Microsoft. Play with transparency to reduce the presence of the image.
How to prepare images for an organization chart?
Would you like to resize, crop, to crop your photos before importing them into Word? Excellent idea ! In a flowchart, images are often modest in size, so there's no need to slow down Word and burden your document with huge image files that are several thousand pixels apart. A JPEG or PNG image of a few hundred KB or 1 or 2 MB is generally sufficient. Demonstrate with free tools provided by your PC or Mac and available to you on the web.
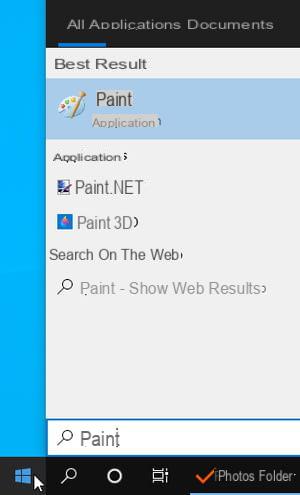
- In Windows, click Start or on the magnifying glass then type the word paint. Select the app Paint that is offered to you.
- After opening an image in Paint, it would be ideal to make a copy of it right away via File> Save As so as not to risk overwriting the original.
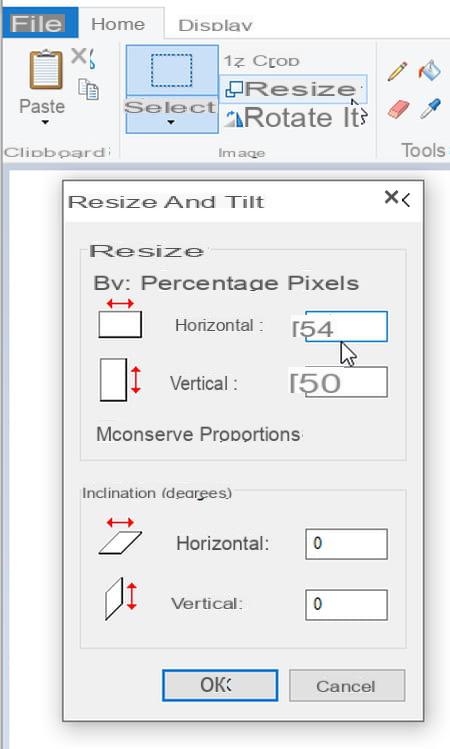
- To resize the whole photo, do not select any part of that image, otherwise only that part will be resized. Click on the button resize. Leave the options checked Percentage et Keep the proportions, then indicate in Horizontal a value of 50, for example, to request a reduction of 50%. Do not hesitate to apply several discounts in a row if the first is not enough (Ctrl + Z on PC or Cmd + Z on Mac for Cancel).
- To crop and crop the image, draw a rectangle around the useful area to keep. Click on the button Crop.
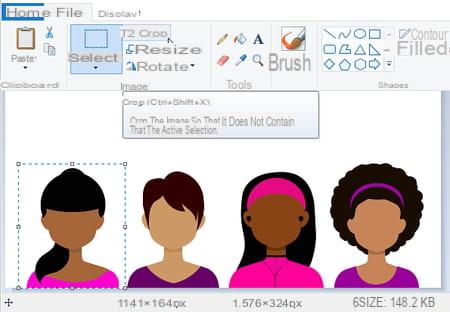
- Only the part that had been selected is kept, everything else is lost.
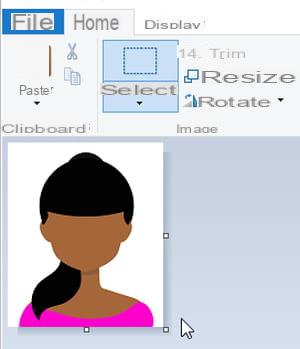
- If you are not working on a copy of your image, be careful when saving the file: choose File> Save As and specify another name to keep the original image.
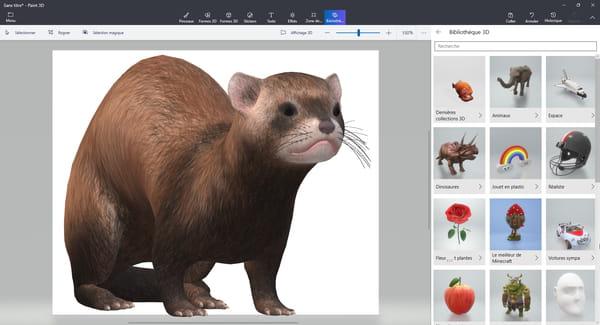
- If you have time, in Windows 10 have fun with Microsoft's app too Paint 3D and its 3D image libraries, some you might find useful in your SmartArt diagrams once converted to 2D.
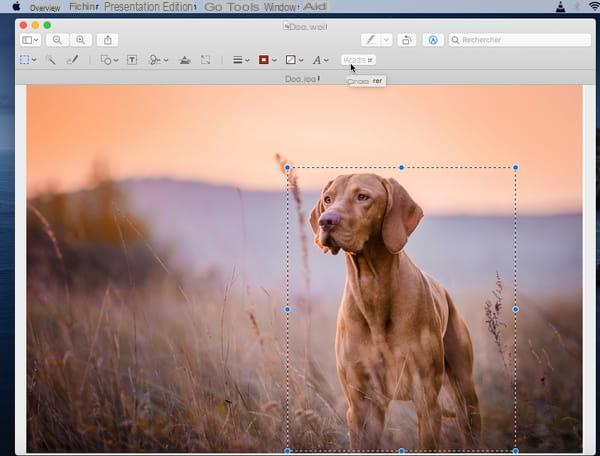
- On Mac, now: double-click for example on your image to open it in Preview. Display the Annotation Toolbar.

- To crop the image, draw a rectangle around the area to keep then click on the button Crop who has appeared.
- To resize the image, point Tools> Adjust Size. Leave the box checked Proportional scale and indicate for example a Width 1000 pixels or less, if it will appear tiny in SmartArt.
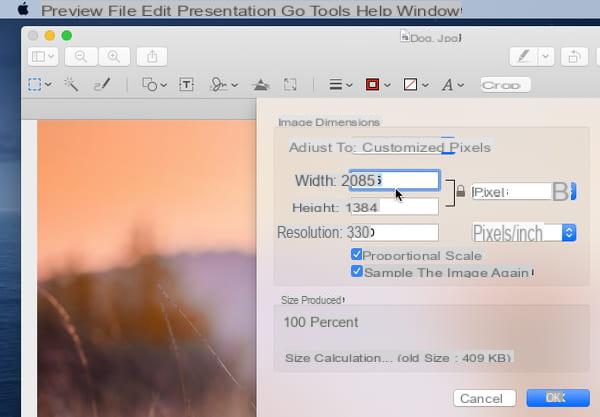
- To save the image without losing the original, choose File> Export.
- On Mac and PC, to crop an image for free, go to the website, for example Remove.bg and press the button Download Image… After sending the file, your image is cropped. Press the blue button Download to retrieve a free low-definition image of the cropped element (the option Download in HD is chargeable).
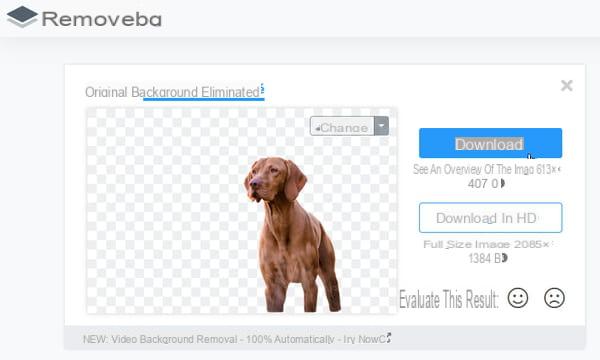
- Click on the button if necessary Edit to restore or erase parts of the image that might have been misinterpreted, or even to add a background provided by the website. Press the button Download at the end of the operation.
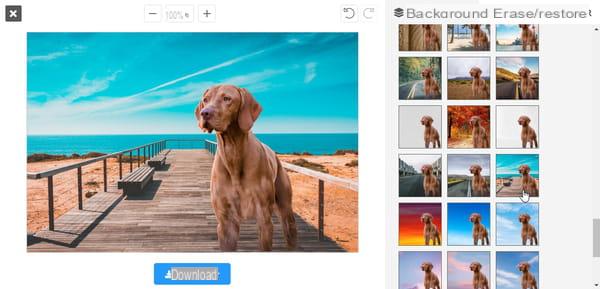
- Rest assured, in the cropped photo shown on the website, the deleted background (which has become transparent) is represented by a checkerboard… which will obviously not appear in your documents! This checkerboard just tells you that if there is a solid background or background image of your clipped image, that background content will be visible in the areas of the checkerboard. So above all around the dog but also between its paws.
- In a SmartArt, you cannot insert a clipped image with a transparent background and an image representing the background in the same block. On the other hand, the color or the background image applied to the whole SmartArt will appear under all the blocks comprising a cropped image with transparent background.


